SparCC
SparCC is a network inference tool that was specifically designed to be robust
to data compositionality. The method is described in
PLoS Comp 8(9): e1002687.
Step 1 - Compute correlations
SparCC is a python program that runs on command line.
Please choose the input file "arctic_soils_filtered.txt".
Compute the compositionality-robust correlations as the median of 10 iterations
as follows:
python SparCC.py arctic_soils_filtered.txt -i 10 --cor_file=arctic_soils_sparcc.txt > sparcc.log
where -i gives the number of iterations over which the correlations are averaged.
SparCC averages its results over several estimates of the true fractions, which it estimates
from the counts using the Dirichlet distribution.
Step 2 - Compute bootstraps
You can then generate bootstraps from the input data using the following command:
python MakeBootstraps.py arctic_soils_filtered.txt -n 100 -o Resamplings/boot
where Resamplings is a directory and boot is the prefix of all resampled data sets. You then have to launch SparCC on each of the resampled data sets. This is best done in a script. Here is a simple script that does the job. As an example, this bash script would generate 10 correlation matrices from the first 10 resampled data sets:
for i in 0 1 2 3 4 5 6 7 8 9
do
    python SparCC.py Resamplings/boot_$i.txt -i 10 --cor_file=Bootstraps/sim_cor_$i.txt >> sparcc.log
done
where Bootstraps is the directory into which correlation matrices computed from the resampled data
matrices will be written.
To compute p-values, more than 10 iterations are needed.
Precomputed bootstrap correlations for 100 iterations
can be downloaded here.
Step 3 - Compute p-values
Once the bootstrapped correlation scores have been computed, the p-values can be generated using
command:
python PseudoPvals.py arctic_soils_sparcc.txt Bootstraps/sim_cor 10 -o pvals_two_sided.txt -t 'two_sided' >> sparcc.log
Step 4 - Visualization
Note that you need to threshold the p-value matrix at the desired cut-off and to
convert it into a network using a script of your own. For example, below is a simple R script
that will perform this task. In the script, the p-value matrix is converted into a matrix
of significances. Do you know why? You can find the answer here.
# load R graph library igraph
library(igraph)
path="pvals_two_sided.txt"
pvals=read.table(path,header=TRUE,sep="\t")
pvals.mat=pvals[,2:ncol(pvals)]
# set p-values of 0 to a non-zero, small p-value so we can take the logarithm
pvals.mat[pvals.mat==0]=0.000000001
# convert into significance
sig.mat=-1*log10(pvals.mat)
# remove all edges with significance below 1
sig.mat[sig.mat<1]=0
sig.mat=as.matrix(sig.mat)
# convert adjacency matrix into a graph
sparcc.graph=graph.adjacency(sig.mat,mode="undirected")
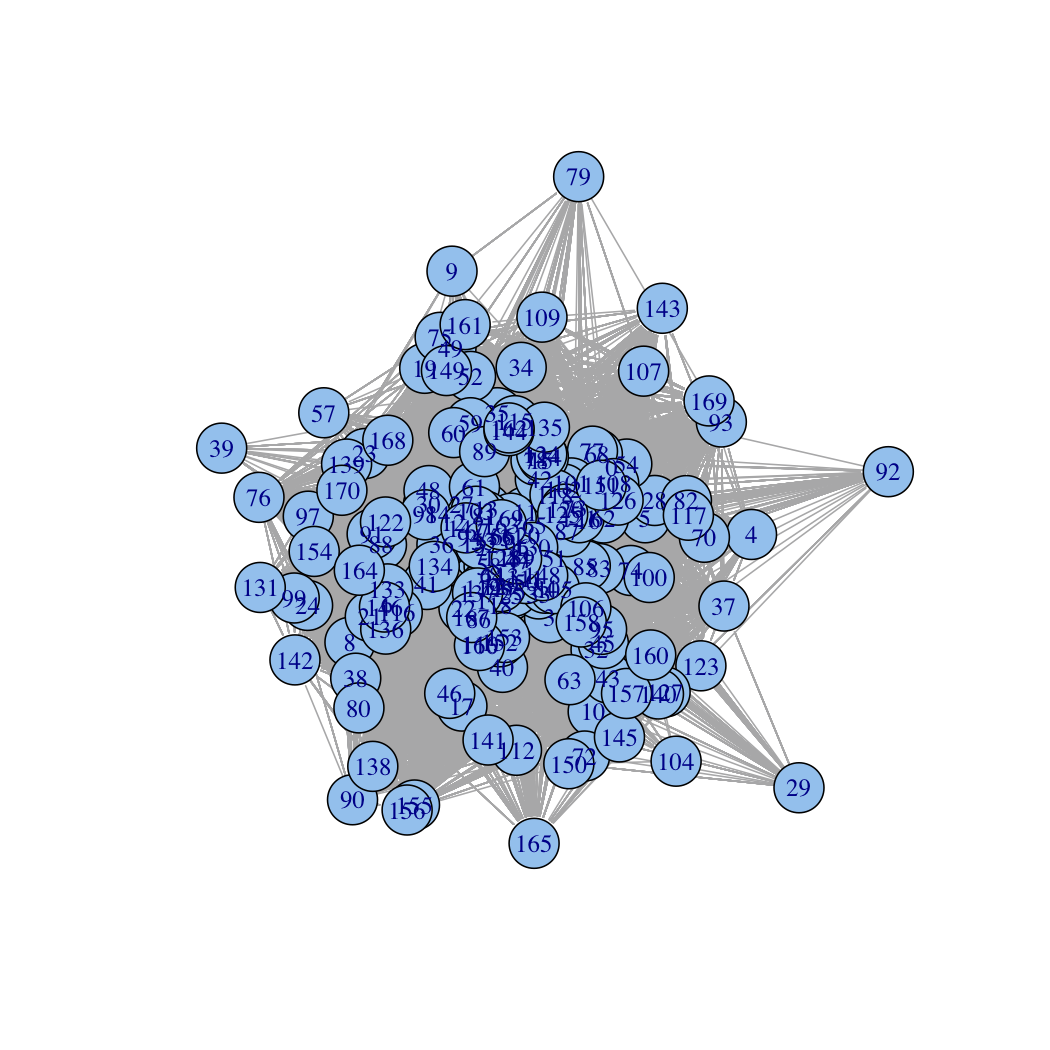
# display the graph
layout=layout.spring
plot(sparcc.graph, layout=layout)